| back |
| GRAPE system overview |
|
Graph visualization system is essentially a tool that accepts graph
topology, i.e. what vertices and edges there are in a graph, and
how they connect with each other, and produces a graph
representation - a mapping of vertices and edges to lines and
curves on the plane.
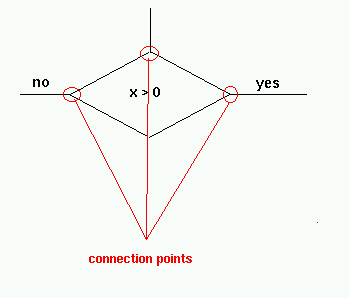
Apart from topology of the graph, a graph visualization system must know how different vertices and edges should look, and the way the should be connected. We tried to catch this information in our data formats. Input dataGraph description, as it comes to GRP tools, consists of two parts: marking that determines different shapes of vertices and edges, and topology that determines graph topology.GRP tools eventually produce representation of the graph that specifies positions of vertices and edges in some coordinate system. MarkingMarking description files (.grm files) define
types of vertices and edges. In practice, different vertex
types correspond to semantically different vertices in a graph - for
example, all conditionals in program block-scheme, or all classes in a
CASE-tool.
From the point of view of GRP tools, vertex type says what shape
should a vertex be, and what connection points it has. A connection
point is a point where an edge can be connected to this
vertex (see fig.1): Complete marking description is a specification of a graph type, like program block-scheme, electronics scheme, or class diagram in CASE tools. All graphs of the same type share one marking description. TopologyTopology description files (.grt files) describe a given
graph.
For every vertex they specify its type, that must be the one from this graph's marking. For every edge they specify what vertices this edge connects, what edge type it has, and to what set of connection points this edge may be attached at its vertices. ToolsGraph visualization system built on GRP consists of representator that accepts marking and topology descriptions and produces a representation, and a front end, that somehow shows this representation to a user.
Currently there is a representator based on stimulated annealing, that
is called Also there is a marking and topology parser and verifier. The former parses the description from simple text format and outputs ASDL pickles, while the latter verifies them. |
| back |
Copyright © OOPS Team
webmaster@oops.math.spbu.ru